AVAILABILITY:
|
The Test-Optional Summary report enables you to see the impact of test score submission on admission results by institutional selectivity and academic performance.
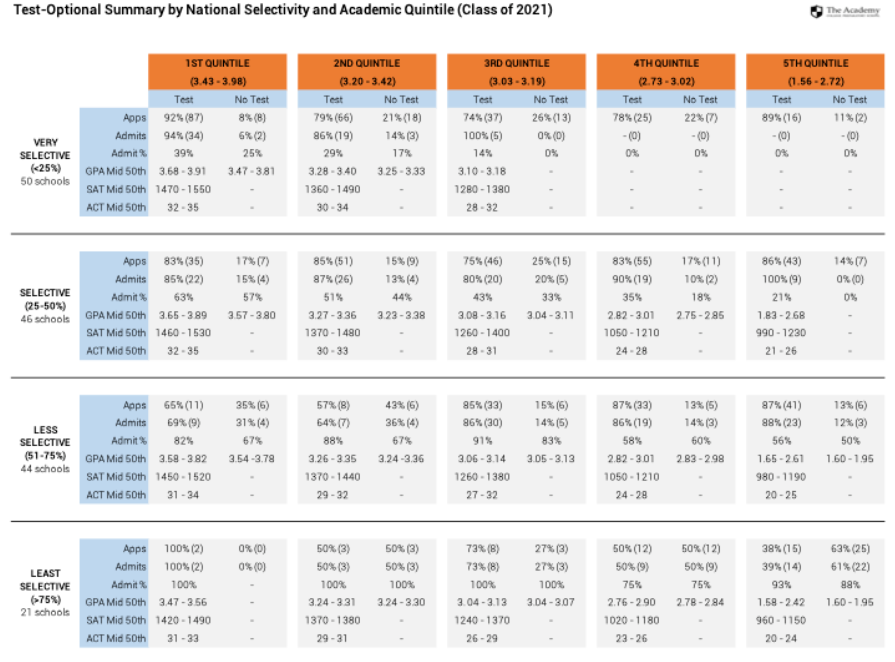
Unlike the Test-Optional Detail reports, this report aggregates all test-optional institutions by national selectivity and compares Test vs No Test results by high school academic quintile. This approach allows you to look for broader patterns when considering test-optional strategies for your students.
This report helps answer one question:
- How do institutional selectivity and applicant academic performance influence test-optional admissions?
This question can be answered by comparing Test vs No Test admission rates by institutional selectivity and looking for trends.
EXAMPLE
First, let’s take a look at the Test vs. No Test results for the 1st quintile students applying to very selective institutions.
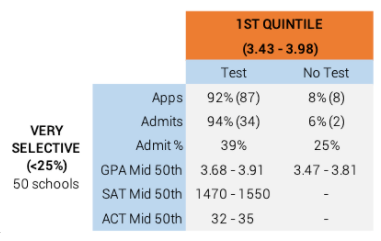
- Top quintile students had a GPA between 3.43 and 3.98.
- Applications were submitted to 50 schools with an overall admission rate <25%.
- In total, 92% of applications included a test score and accounted for 94% of all admittances.
- The mid 50th percentile range of admitted students submitting test scores was 3.68-3.91 (GPA), 1470-1550 (SAT) and/or 32-35 (ACT).
- The mid 50th percentile range of admitted students applying test-optional had a GPA ranging from 3.47 - 3.81.
- The resulting admit rate was 39% for applications with test scores vs. 25% for applications without test scores.
On the surface, the data points to a 14% admission rate advantage for top quintile students applying to very selective schools with test scores.
Now let’s look at 4th Quintile students applying to least selective institutions:
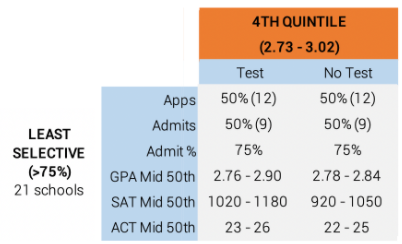
- 4th quintile students had a GPA between 2.73 - 3.02.
- Applications were submitted to 21 schools with an overall admission rate of 75%.
- In total, 50% of applications included a test score and accounted for 50% of all admittances.
- The resulting admit rate was 75% for applications with test scores vs. 75% for applications without test scores.
In contrast to the earlier example, this suggests there is no difference in admission rate between applying with or without a test score and that applicants in this quintile can comfortably apply test-optional without penalty.
By exploring the aggregated data by national selectivity and academic quintile, you may be able to uncover some insights that refine/improve your test-optional strategy. For example:
- All applicants to very selective schools should submit test scores whenever possible.
- All applicants to less selective schools with a minimum GPA of X can freely apply test-optional.